
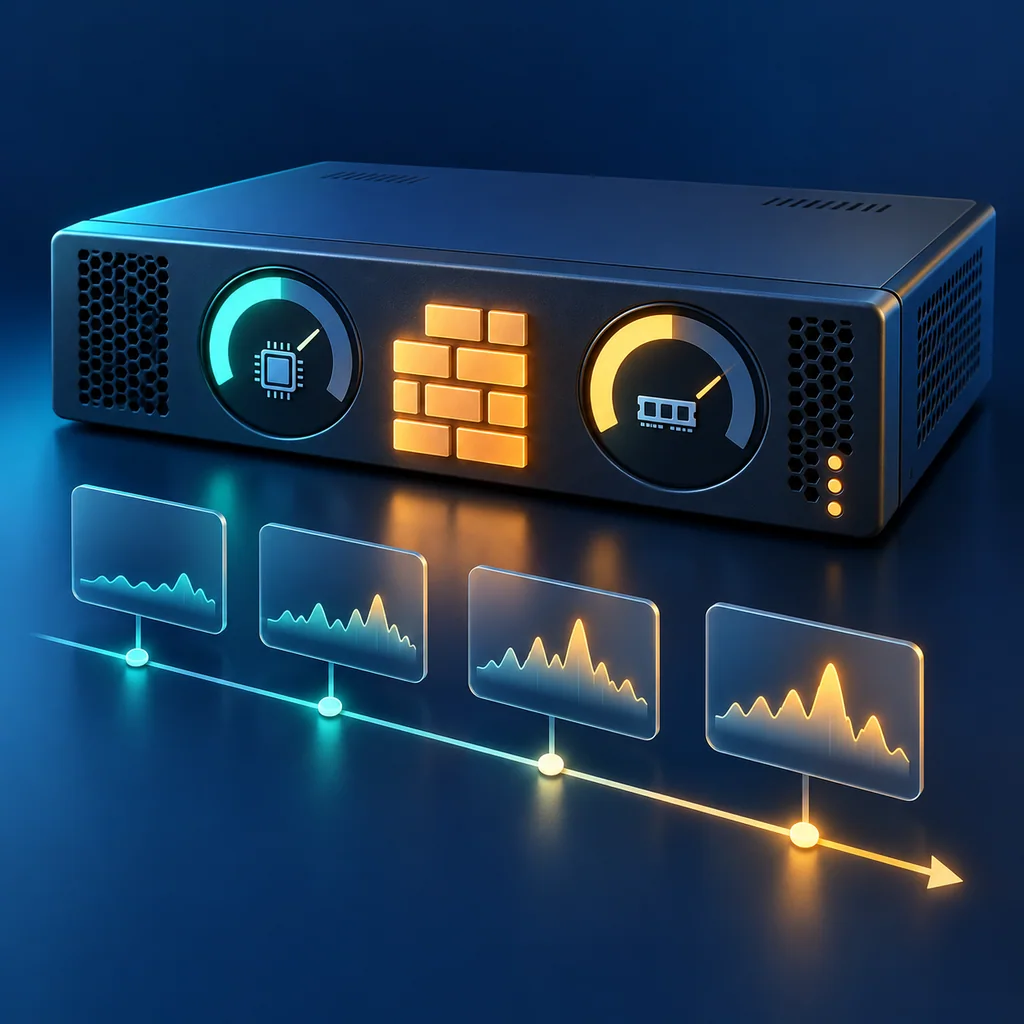
FortiGate Resource Baselines: Read the Sampling Window
Short answer
Use get system performance status to capture a FortiGate resource baseline, preserving the sampling windows and device context printed in the output. Compare repeated captures taken under a known workload. One CPU or memory snapshot does not prove that the firewall is healthy or has enough capacity for a future change.
Scope and prerequisites
The command is documented in the FortiOS 7.6.5 administration guide. Output varies with model, software, operating context and available hardware features. Confirm your installed release and authorization before collecting evidence; do not assume a desktop appliance and a chassis produce interchangeable resource measurements.
This is a read-only baseline workflow. It does not change VDOM context, enable debugging, restart processes or alter inspection policies. Use the current approved administrative context and record it. If a platform-specific guide requires a different context, resolve that requirement before extending the procedure.
1. Define the comparison
Write down what prompted the capture: reduced throughput, slow connection setup, a maintenance preflight or another observable symptom. Include the workload period and the relevant service. A capture made during a quiet interval cannot stand in for peak-hour evidence.
Decide how the baseline will be compared. Use the same appliance, release, administrative context and observation cadence where possible. If an upgrade or workload shift changes those conditions, label the comparison accordingly rather than presenting the difference as a fault.
2. Capture the complete output
Run:
get system performance status
Retain the capture time, prompt and all returned lines in an approved private evidence location. Fortinet documents CPU and memory indicators; additional output can include traffic, sessions, setup rates and uptime. Keep the units and interval labels actually shown by the installed release.
CPU output may divide time into user, system, nice, idle, iowait, irq and softirq categories. These categories describe different uses of processor time. A combined busy percentage alone can hide that distinction.
Record memory exactly as reported. Do not translate a displayed used-memory value into an invented free-capacity promise. Hardware acceleration and enabled inspection features also make cross-model comparisons misleading.
3. Repeat deliberately
Take several captures separated by an agreed interval while recording what the workload is doing. Fortinet's vendor troubleshooting guidance recommends repeating the performance-status command during assessment. Choose a cadence that is useful for the incident rather than issuing an unbounded loop.
Keep each capture separate. If a line reports averages over multiple windows, preserve each window's label. A rate averaged over a longer period can conceal a short burst; a brief capture can miss a recurring event entirely.
Use uptime as context for a recent restart or a discontinuity in the comparison. It is not proof that every service has remained available for the entire interval. If output is incomplete or the session disconnects, label the sample incomplete and preserve the exception.
4. Turn evidence into the next question
Compare repeated samples with the reported symptom and the known baseline. If resource pressure appears persistent, pass the captures and workload context to the owner for the next documented diagnostic step. This command alone does not identify a particular process, rule or customer as the cause.
Avoid restarting the device or changing security policy merely to make a percentage smaller. A corrective change needs a separate scoped procedure, an authorized owner and verification tied to the affected service.
For configuration evidence handling, see FortiGate backup safety. Use the CliDeck workspace to organize an approved capture procedure with clear stopping conditions.
Verification note: acceptance criteria
On the actual FortiGate model and installed FortiOS release, confirm that the command completes in the recorded context, units and sampling windows are preserved, repeated samples have timestamps, and conclusions remain limited to the collected interval. A capacity decision requires workload and service evidence beyond these samples. No device logs, measured incident results or hardware testing are claimed in this article.
Who this is for
This guide is for operations teams, incident responders, network engineers, and system administrators who need to prepare, run, verify, and document operational terminal work on SSH, serial, browser terminal, and infrastructure operations workflows.
When to use this
Use this guide when:
- Several commands or checks must be repeated safely.
- Another engineer, customer, onsite technician, or vendor may need context.
- The work should produce notes, logs, verification, or a clear handoff.
When not to use this
Do not use this guide when:
- You do not own or have authorization to work on the device.
- The device is outside your approved change, recovery, or processing scope.
- The task may expose customer data, secrets, licenses, or credentials that you are not allowed to view or store.
- The work requires vendor-specific approval, legal approval, or a customer-specific procedure that is not covered here.
Practical runbook format
A runbook does not need to be a complex script. For many operations, it can be a plain command list with notes, expected output, stop conditions, verification steps, and rollback instructions.
What to include
- Purpose
- When to use it
- When not to use it
- Target system or device
- Access path
- Read-only checks
- Change steps
- Expected output
- Stop conditions
- Rollback steps
- Verification steps
- Handoff notes
- Final summary format
Workflow
- Define the purpose, target device, access path, and approved scope.
- Run read-only checks first and record the expected healthy state.
- Execute commands from the runbook or handoff plan while watching for stop conditions.
- Verify the final state with independent checks.
- Summarize commands run, outputs reviewed, exceptions, and handoff notes.
Verification checklist
- The target device or system is correct.
- Read-only checks were captured before the work.
- Stop conditions and rollback notes were available before changes.
- Final verification checks match the expected result.
- Notes, logs, and handoff summary are stored where the team can find them.
Common mistakes
- Starting commands before confirming the target device and scope.
- Skipping read-only baseline checks.
- Copying commands without expected output, stop conditions, or rollback notes.
- Closing the work without a final verification summary.
CliDeck workflow fit
CliDeck Workspace is designed for this kind of operational workflow. Teams can keep terminals, notes, runbooks, logs, and shared sessions in one browser workspace instead of spreading work across terminal windows, chat messages, screenshots, and separate documents.
CliDeck runbooks can be plain command lists, one command per line. Operators can send commands with one click or use auto-run behavior that waits for the prompt before sending the next line where configured.
FAQ
Does a runbook need to be code?
No. A useful runbook can be a plain list of commands, checks, notes, expected output, stop conditions, and verification steps.
Why use a browser workspace for terminal work?
A browser workspace can keep terminals, notes, runbooks, logs, and shared sessions together, which helps during incidents, handoffs, maintenance windows, and remote support.
Can shared terminal sessions be safer than screen sharing?
Yes, when implemented with clear view/type permissions. The helper can see the relevant terminal context without taking over the operator’s entire desktop.
Can CliDeck help with this workflow?
Yes. CliDeck Workspace helps organize terminals, runbooks, notes, logs, and shared sessions. Console Server Go is useful when the workflow starts at a rack-side console port.
Related guides
- Linux Transcript Permissions: File and Directory Checks - Inspect Linux transcript files, parent directories and ACLs before sharing, with clear limits for umask and copies elsewhere.
- Arista EOS NTP Checks: Status and Associations - Read EOS NTP status and associations together, preserve release differences and avoid unsupported claims about clock accuracy.
- Junos Session Checks Before Maintenance - Check Junos administrative sessions before maintenance, coordinate ownership and preserve the limits of the session view.
- Arista EOS Cooling Checks: Fans, Airflow and Sensors - Inspect EOS fan rows, airflow and sensor thresholds together; retain unknown states and avoid declaring hardware healthy from a summary alone.
- Junos Storage Preflight: Filesystems Before Maintenance - Capture Junos filesystem usage before maintenance, map the relevant mount, preserve units, and leave cleanup decisions to a separate approved plan.