
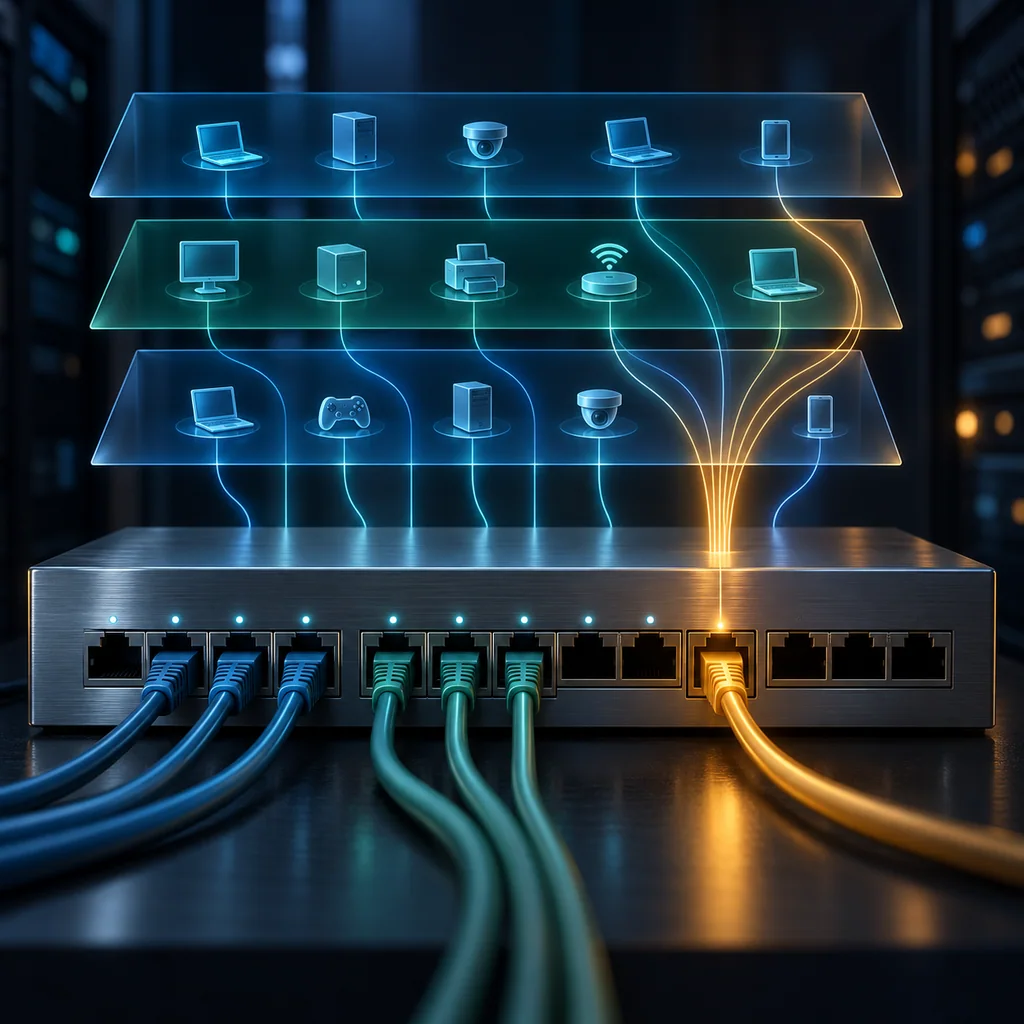
Cisco Catalyst MAC Tables: Trace a VLAN Without Guessing the Endpoint
Short answer
Inspect a Catalyst MAC address table within the intended VLAN, preserve the entry type and learned port, and treat the result as a forwarding observation. A dynamic MAC entry tells you where the switch learned a source address. It does not prove that the device is directly attached to that socket or that the application works.
This workflow uses the Catalyst 9300 IOS XE 17.12 command reference. It applies to owned or customer-authorized switches and an approved privileged EXEC inspection session. Interface names, fabric forwarding entries and security features vary by platform and configuration.
Record the question and its VLAN
Before collecting output, write down the authorized device identity, the VLAN being investigated and the reason for the lookup. Keep actual MAC addresses, hostnames and asset identifiers in the private work record.
Start with a version record, then inspect the selected VLAN. VLAN 20 below is an example selector, not an instruction to create or change a VLAN:
show version
show mac address-table vlan 20
Retain the whole row: VLAN, address, type and port. Searching only for an address can hide which Layer 2 domain the observation belongs to. A row associated with CPU, an internal interface or a fabric-specific entry is not automatically a customer-facing cable port.
Do not turn every row into a physical endpoint. Static, secure and control-plane entries require their own interpretation; they are not interchangeable with ordinary dynamic learning.
Separate dynamic learning from the full table
Use the documented dynamic filter when the specific question concerns learned addresses:
show mac address-table dynamic vlan 20
Compare this result with the unfiltered VLAN view. The dynamic filter intentionally omits other entry types, so an empty filtered result does not establish that the VLAN's entire table is empty.
Dynamic learning uses received source addresses, and entries can age out. A quiet endpoint can disappear from the table without being disconnected. Conversely, an entry may remain for part of its aging interval after an endpoint stops sending traffic.
Inspect the configured aging value rather than assuming a universal timer:
show mac address-table aging-time vlan 20
Record the collection time separately. The aging setting is context for the table, not a precise timestamp for the last packet from every entry.
Inspect the port without guessing the topology
Replace the interface below with the exact interface in the approved investigation:
show mac address-table interface GigabitEthernet1/0/1
Preserve all VLANs and entry types returned for that interface. Multiple addresses can be expected behind an uplink, access point, hypervisor or downstream switch. Their presence alone does not prove a loop or a wrongly connected cable.
Similarly, seeing one address does not prove that only one appliance exists downstream. Traffic patterns, VLAN selection and aging influence what is visible.
Use the observed port as the next point in a documented trace. Correlate it with the approved topology, neighbor discovery and physical labels. If the port is an aggregate or an unexpected interface type, stop treating it as a single socket and resolve its meaning through that platform's documentation.
Keep before and after evidence comparable
For a second observation, retain the same switch, VLAN and filters, and record a new collection time. Write down whether a row persisted, disappeared or appeared at a different port. A changed row requires investigation; two snapshots alone do not establish the cause.
Do not clear the MAC table to force a clean display. Clearing destroys the current learning baseline and changes forwarding behavior. Do not change trunk allow-lists, port security or VLAN membership as part of this inspection.
An absent row should be recorded as “not observed with this filter at this time.” An unexpected row should retain its actual type and interface rather than being rewritten into the expected answer.
Verification note: criteria for a MAC-table trace
For the documented Catalyst 9300 IOS XE 17.12 command family, an acceptable record contains the exact VLAN, full matching rows, entry types, port identifiers, collection times and relevant aging context. The conclusion must distinguish a learned forwarding location from a confirmed physical endpoint.
These are operator acceptance criteria, not a captured switch test. No live MAC table or physical cable trace is claimed here. Missing entries and topology mismatches remain unresolved until corroborated.
Use Catalyst LLDP endpoint checks for the separate neighbor and physical-label checkpoint. Preserve the intended device identity using the wrong-device prevention guide, and keep the trace in the CliDeck workspace.
Who this is for
This guide is for operations teams, incident responders, network engineers, and system administrators who need to prepare, run, verify, and document operational terminal work on approved network devices inside a planned change or lab scope.
When to use this
Use this guide when:
- Several commands or checks must be repeated safely.
- Another engineer, customer, onsite technician, or vendor may need context.
- The work should produce notes, logs, verification, or a clear handoff.
When not to use this
Do not use this guide when:
- You do not own or have authorization to work on the device.
- The device is outside your approved change, recovery, or processing scope.
- The task may expose customer data, secrets, licenses, or credentials that you are not allowed to view or store.
- The work requires vendor-specific approval, legal approval, or a customer-specific procedure that is not covered here.
Practical runbook format
A runbook does not need to be a complex script. For many operations, it can be a plain command list with notes, expected output, stop conditions, verification steps, and rollback instructions.
What to include
- Purpose
- When to use it
- When not to use it
- Target system or device
- Access path
- Read-only checks
- Change steps
- Expected output
- Stop conditions
- Rollback steps
- Verification steps
- Handoff notes
- Final summary format
Most common default
Most network console ports use 9600 8N1, but many modern switches, appliances, and server-management interfaces use 115200. Some devices use other speeds such as 38400, 19200, 57600, or 2400.
Notable exceptions
Examples:
- FortiSwitch often uses 115200.
- HPE Aruba AOS-CX often uses 115200.
- Dell OS10 often uses 115200.
- MikroTik RouterOS commonly uses 115200.
- TP-Link JetStream examples may use 38400.
- F5 BIG-IP may use 19200.
- Some UPS serial protocols may use 2400.
How to use this table
Use the table as a starting point, then verify the setting against the device label, approved device procedure, site runbook, or known-good console output. If the terminal shows unreadable characters, test the likely baud rates before assuming the cable or port is broken.
Verify against the device-specific procedure
Do not treat a reference table as a substitute for the approved device-specific procedure, site policy, or a verified device-specific runbook when the operation is risky.
How CliDeck helps
CliDeck helps teams keep console settings, notes, runbooks, and terminal sessions organized. Console Server Go can show the current UART speed on its built-in screen. Net Controller can help teams process multiple devices with standardized workflows where configured.
Workflow
- Define the purpose, target device, access path, and approved scope.
- Run read-only checks first and record the expected healthy state.
- Execute commands from the runbook or handoff plan while watching for stop conditions.
- Verify the final state with independent checks.
- Summarize commands run, outputs reviewed, exceptions, and handoff notes.
Verification checklist
- The target device or system is correct.
- Read-only checks were captured before the work.
- Stop conditions and rollback notes were available before changes.
- Final verification checks match the expected result.
- Notes, logs, and handoff summary are stored where the team can find them.
Common mistakes
- Starting commands before confirming the target device and scope.
- Skipping read-only baseline checks.
- Copying commands without expected output, stop conditions, or rollback notes.
- Closing the work without a final verification summary.
CliDeck workflow fit
CliDeck Workspace is designed for this kind of operational workflow. Teams can keep terminals, notes, runbooks, logs, and shared sessions in one browser workspace instead of spreading work across terminal windows, chat messages, screenshots, and separate documents.
CliDeck runbooks can be plain command lists, one command per line. Operators can send commands with one click or use auto-run behavior that waits for the prompt before sending the next line where configured.
FAQ
Does a runbook need to be code?
No. A useful runbook can be a plain list of commands, checks, notes, expected output, stop conditions, and verification steps.
Why use a browser workspace for terminal work?
A browser workspace can keep terminals, notes, runbooks, logs, and shared sessions together, which helps during incidents, handoffs, maintenance windows, and remote support.
Can shared terminal sessions be safer than screen sharing?
Yes, when implemented with clear view/type permissions. The helper can see the relevant terminal context without taking over the operator’s entire desktop.
Can CliDeck help with this workflow?
Yes. CliDeck Workspace helps organize terminals, runbooks, notes, logs, and shared sessions. Console Server Go is useful when the workflow starts at a rack-side console port.
Related guides
- Linux Serial Settings: Inspect stty Without Guessing the Console Profile - Inspect GNU stty settings for an identified serial adapter, compare framing and flow control, and account for device-open effects and session ownership.
- Linux Serial Adapter Identity: by-id vs by-path Before Reconnecting - Compare Linux USB serial by-id and by-path links, inspect udev properties, and resolve the intended adapter before reconnecting a console.
- FortiGate Routing Table Checks: Find the Route Without Claiming Packet Success - Inspect the FortiGate IPv4 routing table in the right VDOM and VRF, preserve route fields, and separate routing state from actual packet success.
- Linux Serial Port Busy: Identify the Owner Before Disconnecting - Identify the process occupying a Linux serial device, release only the intended session, and verify access without killing unrelated processes.
- Cisco IOS XE Terminal Pagination: Capture Complete Console Transcripts - Remove IOS XE page pauses for one session, capture complete command output, inspect long lines, and restore the original terminal settings.